Step Data Insights #2 (WK25)
A comparative look at Magic Eden vs Opensea
Introduction
Welcome to volume 2.0 of the Step Finance Newsletter. In last week's edition, we went over the explosive growth of Orca, and their current monopoly on the Solana DeFi space. In this week's edition, we continue with a mammoth of the NFT Solana ecosystem segment, looking at Magic Eden.
Magic Eden Explosive Growth
Since September 2021, Magic Eden has blossomed from a small NFT marketplace, into one of the primary players of the cryptocurrencies NFT space. This is best demonstrated with their daily transactions increasing by +1,134% from October to June.
During this period, Magic Edens increasing transaction volume has displayed a strong negative correlation against the price of SOL, with an R value of -0.7733.
This exceptional performance, against the grain of the market has resulted in a SOL NFT volume dominance of 92.2% with Magic Eden now ruling the Solana NFT space.
Since April Opensea (ETHs largest NFT marketplace) have attempted to gain a slice of the action, supporting Solana based NFTs. Although, during this period they have gained a measly 2.9% Solana NFT market share. Why is this the case, how could the most well known NFT marketplace not devour Magic Eden?
Opensea Comparatively Struggling
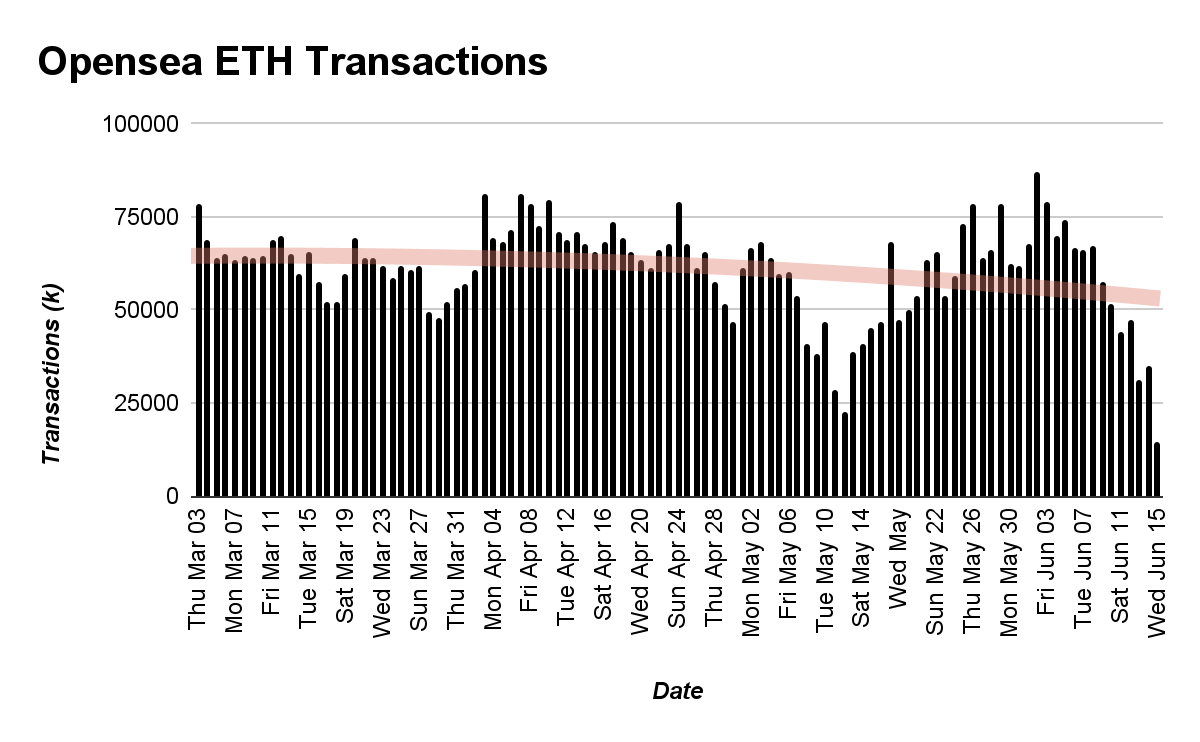
Since the beginning of March, Opensea has seen their ETH transaction volume dwindle. The transactions for the marketplace are gradually declining. When compared to Magic Eden, the graphs make a grim reading for Opensea, with Magic Eden transactions on a clear upwards trajectory, displaying an inverse correlation between the two.
The initial thought to take is that Opensea is struggling due to decreasing ETH blue chip NFTs floor prices, as shown below.
This is a contributing factor, as bullish price action draws in users, and periods of prolonged negative price action sees users disappear, while we are ultimately focusing on Solana NFTs, both of which are listed on both Opensea and Magic eden. It appears that the primary reason for Opensea struggles is due to their core demographic. Opensea traders on average trade significant sums of capital per trade at $2087 USD on average over the past three months.
This is in comparison to Magic Eden traders, who on average have traded $684 USD per transaction.
On face value this trade value differential displays Magic Eden traders in a negative light. However, when we dig deeper we can see the stark differences between the core user base of Magic Eden and Opensea; this difference is transactions per user.
Why Opensea Want Magic Edens Solana NFT Traders
Over the past three months active Opensea users have on average conducted 1.87 transactions per day. In comparison, active Magic Eden has on average conducted an impressive 7.65 transactions per day. This displays high levels of engagement from Magic NFT users, despite market conditions being atrocious. The average transaction levels of Magic Eden users is up +64.87% since the 03/03/2022 to present. In comparison, the average transactions per day of Opensea users is down - 2.08%.
Author: @page_analyst


